I really appreciate the answers of Gabeusa and Juliabarney02. They are both great advices. Here is some extra information I got from a colleague about this topic:
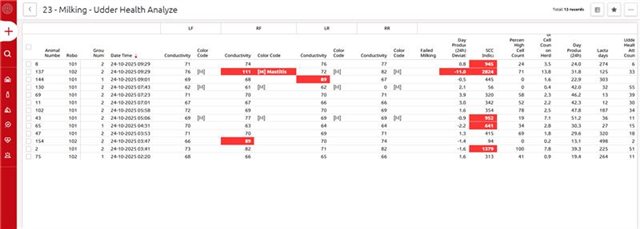
1. Monitoring Udder Health in Horizon: The most effective way to track udder health is by using the Udder Health Task and Reports 12 & 23:
The Udder Health Task automatically highlights cows with deviations in conductivity, somatic cell count (SCC), and milk production.
Report 12: Udder Health Worklist and Report 23: Udder Health Analysis provide detailed overviews of these deviations, including milk separations.
You can customize the thresholds for these alerts in Manage → Health → Attention Settings, adjusting preferences for SCC, conductivity, milk yield, temperature, and more.
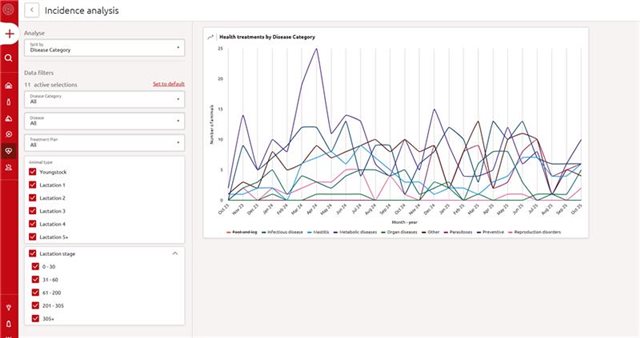
2. Trend Analysis for Chronic Cases & Treatment Effectiveness: Use the dry off treatment analysis and the health treatment analysis to help you for trend analysis and treatment effectiveness.
Dry-Off Treatment Analysis; The dry-off analysis shows SCC trends before and after calving, while the health treatment analysis allows filtering by disease category, lactation stage, number, and more. Note: treatment plans must be entered in Horizon.
Health Treatment Analysis; This analysis page can help farmers evaluate treatment outcomes and identify chronic cases. Note: treatment plans must be entered in Horizon.
3. Follow-Up with Your Veterinarian: Use the insights from the udder health task and reports to follow up on cows with remarks. Collaboration with your vet is key to effective treatment.
We hope this helps you get the most out of Horizon when it comes to udder health!
One thing we also do is add a reminder "health" when we are monitoring cow health but have not started treatment yet. That way, if someone else is on cow health the next day, the follow up is still guaranteed.
That’s a smart system. Those little reminders make a big difference, especially when different people rotate through cow health. It’s way too easy for a cow that’s “being watched” to fall through the cracks if nothing is officially started yet. Having that “health” tag in place keeps everyone on the same page and makes sure the follow-up actually happens. Good teamwork tool.
Sobre o assunto (Análise de Tendências para Casos Crônicos e Eficácia do Tratamento: Utilize a análise do tratamento de secagem e a análise do tratamento de saúde para auxiliar na análise de tendências e na avaliação da eficácia do tratamento.)
Pode esplanar melhor? Estou com dificuldade de encontrar os relatórios mencionados.
Sorry for the late reply, I missed your question! The analyzes bvandenberg is talking about are dry off treatment analysis and the health treatment analysis.
Dry off treatment analysis has been developed to analyse the effect of dry off treatments in the herd over time. The results shown in this tool can be used to optimise and fine tune dry off treatments in the future based on their monitored effectiveness. For more information see the document Dry off treatment analysis on the Help page. Where to find the dry off treatment analysis page:
Reports>Health(tab) >Dry off treatment analysis(top right-hand corner)
The health treatment analysis 'hides' under the Health analysis widget on the health dashboard. The health analysis widget is aimed to give insights into which diseases and related health treatments affect the herd with the highest incidence. The widget shows the highest five cumulative health incidences for last rolling 90 days, each compared with the average of a reference period (quarter average of the last four quarters). If hovering over the graph, it’s possible to see the number of animals treated per category. If you click on 'Analyze' in the widget (right bottom corner) you will find the health treatment analysis. In this analysis you can deep dive further in your health treatments by adding filters. The graph will show you the number of animals that received a certain treatment for each month during the last 24 months. For more information see the document Health analysis widget on the Help page.