



The total milk production on a farm varies over the year. This variation can be caused by the number of cows being milked, the lactation stage and other factors such as feed quality. By having insight into the future predicted production, the farmer can for example, take action to increase or decrease milk production.
The prediction is based on the production data of the herd during the current and previous lactation. For every day after calving, the average milk production per day of the herd is taken. This gives a lactation curve for the average cow in the herd and is used as a starting point.
Then for each cow, this overall herd lactation curve is refined using her production data of the current and previous lactation to create a cow specific milk yield prediction.
All the individual cow milk yield predictions are then combined to generate a farm level milk yield prediction per month. This takes into account at which stage the cows are in their lactation.
You can find the milk yield prediction for each individual cow on the cow card.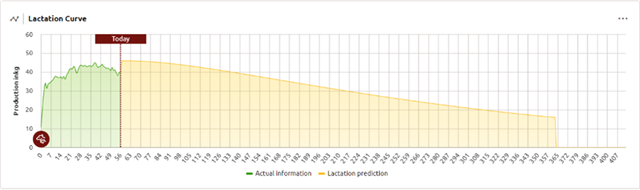
On the farm dashboard you can add the widget 'Milk Yield Prediction', this is the milk yield prediction for the whole herd. 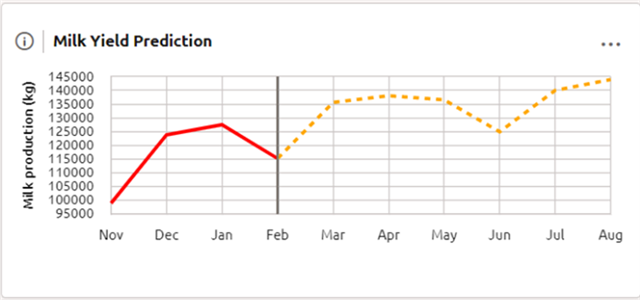
Good to know
• Heifers have no data of previous lactations, so the calculation of the milk yield prediction of her first days is based on the average milk production for heifers on the farm.
• This model relies on data and therefore it takes some time (+- 30 days) before there is enough data to make the prediction.
• Cows with a keep open status are included in the milk yield calculation till they are transferred out in Horizon.
• February is a shorter month, so on herd level, the total milk yield prediction is lower than other months.
Top Comments