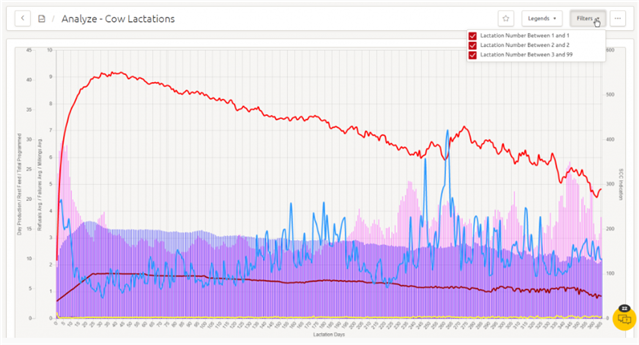
This graph provides an overview of the feeding and milking performance of the herd throughout lactation. It is possible to filter the graph on only 1st, 2nd, 3rd and higher lactations or combined using the filter options.
Graph 52 shows the milk yield, number of visits, feed intake, animal weight and fat and protein levels of all cows currently milked in the robot in relation to the number of days in lactation.

Where can you find the graph?
Go to Reports > Milking > 52 – Analyze – Cow Lactations
How do you evaluate the graph?
All the factors used to create graph 52 can help with the evaluation of the following:
- Peak milk production.
- Persistency of the yield throughout lactation.
- Loss of weight (only applicable with weighing floor) and negative energy balance in early lactation.
- Amount of concentrate feed used for milk production.
- Number of milkings/refusals per cow in early and later lactation.
- Milk contents levels throughout lactation.
All factors can be disabled and enabled in the Legends dropdown beside Filters. The specific numbers will appear if the mouse is moved over the graph.
