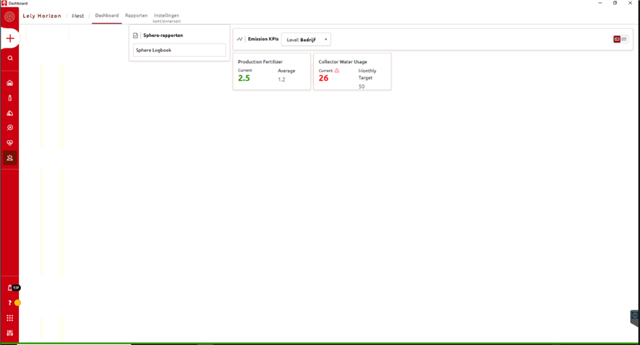
Horizon is a management system in which you can find useful information on your farm performance. The so called KPIs are key performance indicators that show the farm specific information regarding several topics. On the dashboard for Manure, you can find several items. Under the Sphere-reports you can find the Sphere logbook which you can open to find information about for example electrical current, usage of water and production of fertilizer, filtered by date and time.
Within the Emission KPIs on the dashboard you can find Production Fertilizer and Collector Water Usage. For these KPIs the current and average numbers are shown. The Production Fertilizer shows the current production (when green, there is a good constant production; when red, there is no or little production of fertilizer). The Collector Water Usage KPI shows the current usage of water used by the Collector, next to the monthly target that is needed as stated by the RAV. In this way you do not need to calculate the amount of water to reach the 3L water/m2/day. When the monthly target will not be reached by the current water usage, the number will appear as red, which indicates that you need to switch on both water nozzles of the Collector.

When clicking on the Sphere Logbook under Sphere-reports, you see the screen below.

This report shows an overview of different parameters for the whole Lely Sphere system, every half an hour. In this overview you can find electrical conductivity, density, production of fertilizer, cumulative production of fertilizer, airflow, water usage of the Collector, calibration, airflow of the main N-Capture, under pressure of the main N-Capture, airflow of the side N-Capture and under pressure of the side N-Capture.
