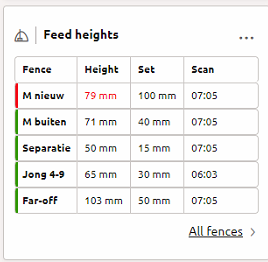
The feed-heights widget gives the option to see the feed levels at the feed fences scanned by the Vector. This information will give you insights into the actual feeding status. The widget itself shows the five most critical fences, which are most likely to be fed at first. Clicking on the widget redirects you to the analysis page where you can carry out further analysis of the feed height per fence.
How to add the widget
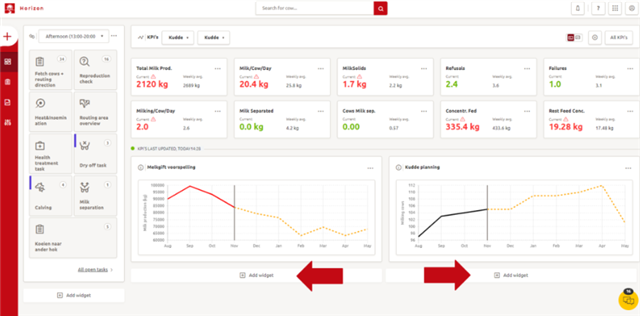
Step 1: The Feed heights widget can be added to the dashboard by clicking on ‘add widget’.

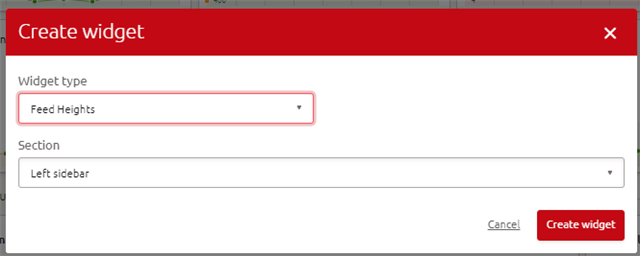
Step 2: Select ‘Feed heights’ as the widget type in the pop-up screen. Select the preferred dashboard section in which the widget needs to be added (‘left sidebar’ or ‘main’). Click on ‘Create widget’.

Step 3: The widget appears in the dashboard and shows the feed heights of five fences

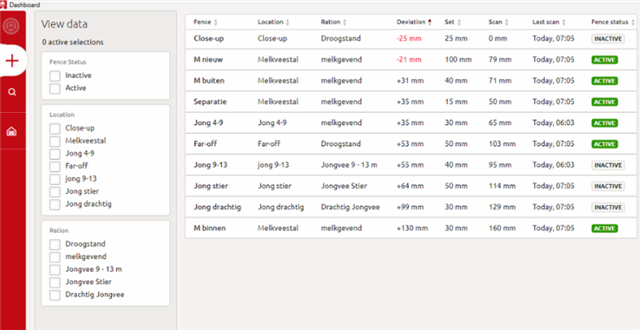
Step 4. Clicking on the widget redirects you to the analysis page. On the left side of the page there are the following filter options: location status, ration and location name.

The ‘Fence status’ column could give a reason why the scanned feed height is low, for example when a fence is set to ‘Inactive’ or ‘Paused’.
