Cowcard overview and customization
Not only is the dashboard customizable for a farmer, but the cow card overview can also be modified as required. As a farmer, you can set up your own dashboard for the cow card. The overview page provides a great deal of information on how the cow is performing. All the information you might need is shown clearly and in one simple overview on this page.
How do you customize your cow card overview?
Step 1: On this page you can only add/remove widgets or move widgets somewhere else
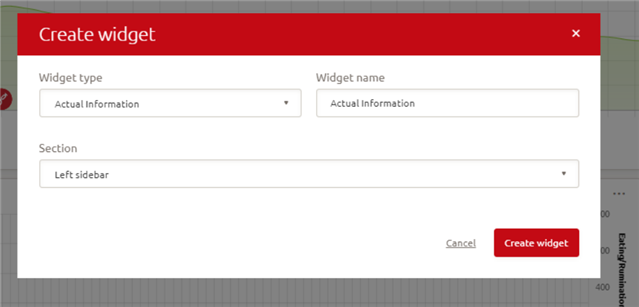
Step 2: While on the cow card overview -> click Add widget
Step 3: Choose the widget you want to see on the screen
Step 4: Choose if you want to have the widget on the left side bar or in the main dashboard
Step 5: Click on Apply changes to save the changes you have made
Cow card feed
How do you move widgets on your cowcard overview?
Step 1: Click on the three dots.
Step 2: Choose if you want to have the widget on the left side bar or in the main dashboard.
Step 3: Click on Apply changes to save the changes you have made.
In the tab feed, you can see how many feeds a cow receives today and the history in graphical form. Daily shows a clear overview per day and Visits shows how much feed the cow receives per visit.
How do you use the feed tabs in the cowcard?
The Feed tab in the cowcard is actually made up of 3 tabs:
Today Daily Visits
1) Today
Step 1: Go to cowcard > Feed > Today
Step 2: This shows a clear overview of the amount of concentrate fed and lactation days.
Step 3: Below you can see a table with the details per kind of concentrate.
Normally they run automatically, but if you click on the method box you can specify that the feeding of this cow should be automatic or fixed.
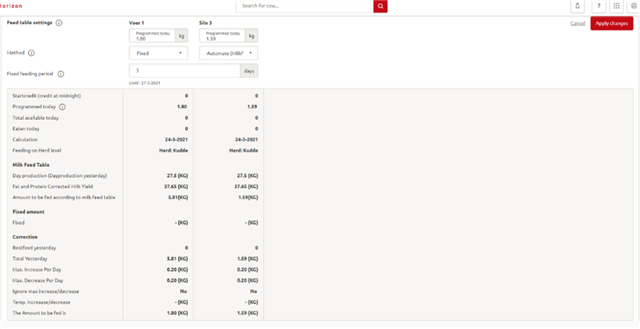
Step 4: If you choose automatic, the cow will be fed concentrate according to the feed table for her group.
If you choose fixed, you can directly enter the amount of feed yourself. This is shown in the box above.
In the box below, you can specify for how many days this cow will be fed by fixed feeding.
Step 5: Click Apply changes to save the changes you have made.
2) Daily
Step 1: Go to cowcard > Feed > Daily
Step 2: You will be shown a clear overview of what has been fed over the last 14 days.
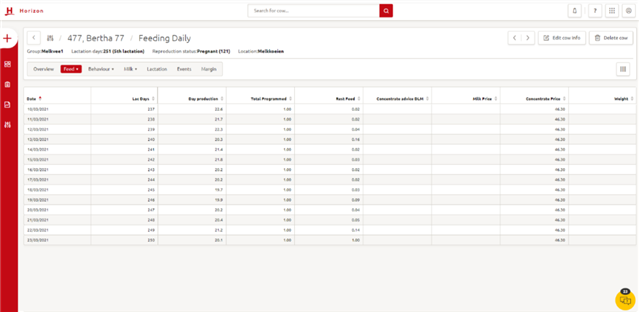
Step 3: If you click on the 4 bars in the top right-hand corner of the table, a new window will open.
This window is used to customize the table.
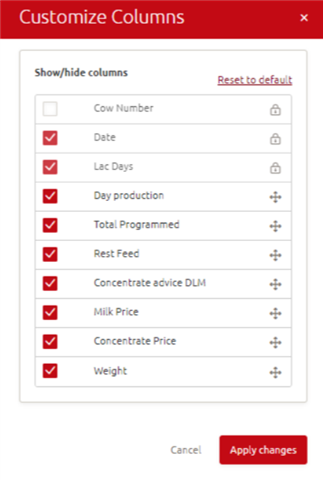
Step 4: Click on Apply changes to save the changes you have made.
3) Visits
Step 1: Go to cowcard > Feed > Visits
Step 2: You will be shown a clear table of what has been fed per robot visit.
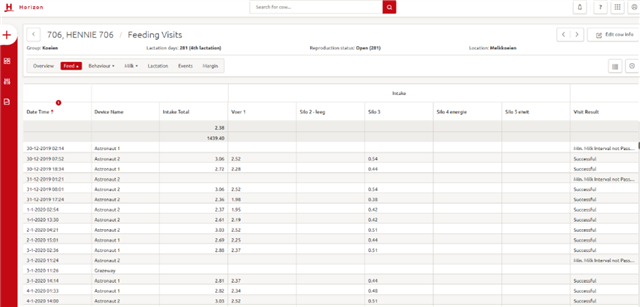
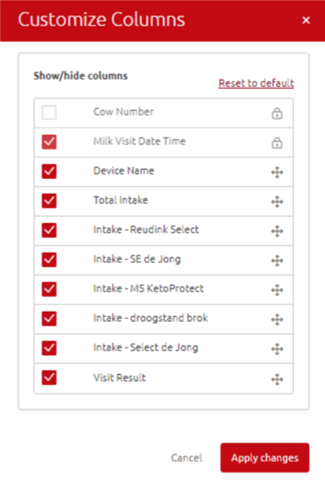
Step 3: If you click on the 4 bars in the top right-hand corner of the table, a new window will open.
This window is used to customise the table.
Clicking on the wheel for the settings in the top right-hand corner of the table will open a new window.
In this window, you can choose if you want the table to display information between specific dates or for a certain number of days.
Step 4: Click on Apply changes to save the changes you have made.
Cowcard behaviour
A cow’s behaviour is influenced by a variety of factors. Characteristics associated with an individual cow – such as health, reproduction, stress – can be distinguished. External factors – such as the barn surroundings, milking equipment, milking process, feeding management and climate – may also affect an individual cow’s behaviour.
How do you use the behaviour tab in the cowcard?
Step 1: Go to the cowcard and select the behaviour tab.
Step 2: You will now be shown a clear overview of the cow’s behaviour.
You can see:
– Eating minutes
– Rumination minutes
– Day production, and an attention if there is any deviation
– Activity
– Heat probability and a threshold
Step 3: Clicking on the wheel for the settings in the top right-hand corner of the table will open a new window.
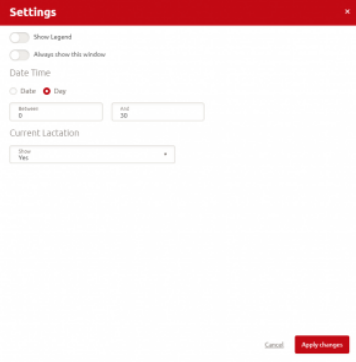
Step 4: Use this window to personalise the graph. You can choose whether to display the information for the last couple of days, or for between two dates.
You can also choose if you want the graph to show the current lactation or a previous one.
Step 5: Click Apply changes to save the changes you have made.
Milk cowcard
The Milk tab shows all the relevant information on milk-related data such as the quality of milk, the values and data related to visits. In Lely Horizon, there are three sub-headers:
- Daily
- Quality
- Visits
How do you use the milk tabs in the cowcard?
1) Daily
Step 1: Go to cow card -> Milk -> Daily
Step 2: A table will be opened. This table gives a good overview of the milkings per day, milking information, feed distributed by the robot and the cow’s production.
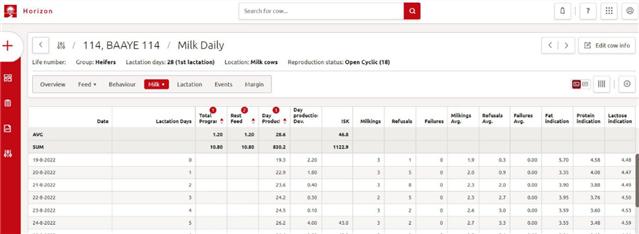
If you click on the 4 bars in the top right-hand corner above the table, a new window will open where you can personalise the table.
Click on Apply changes to save the changes you have made.
If you click on the wheel for the settings on the right-hand side above the table, you can choose between showing a period of days or a range of dates for a period you want to know about.
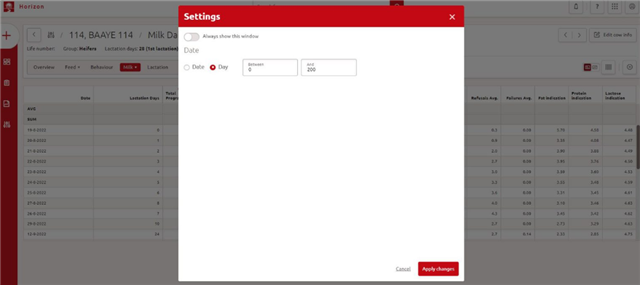
Click on Apply changes to save the changes you have made.
Step 3: If you click on the graph icon on the right-hand side above the table, the table will be displayed as a graph.
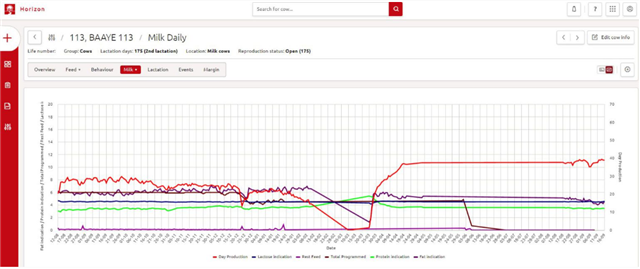
The graph shows information about the feed (total amount and rest feed), and the milk production & quality (production by day, protein-, fat- and lactose indication)
If you click on the wheel on the right-hand side above the graph, you can choose between showing a period of days or a range of dates for a period you want to know about and showing only current lactation or the lactation history, too.
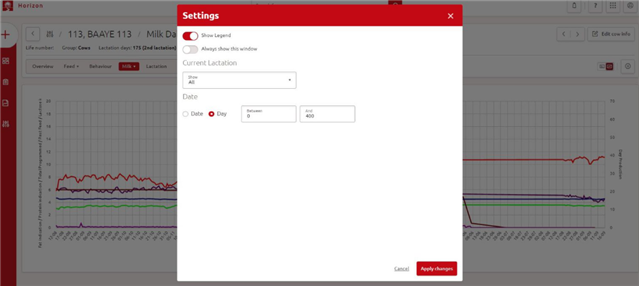
Step 4: Click on Apply changes to save the changes you have made.
2) Quality
Step 1: Go to cowcard > Milk > Quality
Step 2: A table will open where you can see precise information on production and quality per quarter and per milking. Because it is per milking, you can exactly see what happened and when.
If the quality deviates, the quality number in the table will appear in red to indicate there is something wrong.
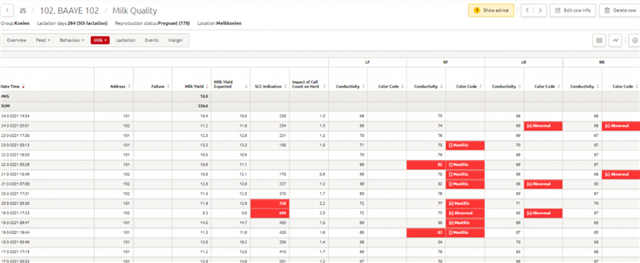
Step 3: Above the table there is a graph icon which will change the table into a graph. The graph shows the same values as in the table, but in graphic form. If a value deviates, a yellow box will pop up describing the issue.
Step 4: On this page you can also customize the table and change the settings for the table and the graph. Once you have finished, click on Apply settings to save the changes you have made.
3) Visits
Step 1: Go to cowcard > Milk > Visits
Step 2: A table will open. This table contains all the information about visits to the robots.
One of the most important details here is the result of a visit. You can see whether the milking was successful or a failure, or if the milk interval was not passed.
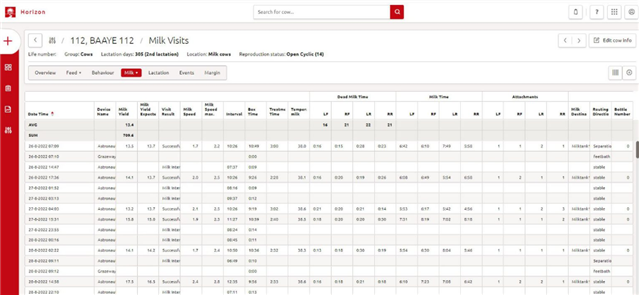
Step 3: You can also change the settings for the table by clicking on the wheel.
Cowcard lactation
The lactation tab shows production information about the current and previous lactations. This table provides a clear overview of the data from each cow per lactation. This page also describes the live-time production of this cow.
How do you use the lactation tab in the cowcard?
Step 1: Go to the cowcard -> Lactation
Step 2: A table will open. In this table, you can see all the lactations for a cow.
All the information on milk, milkings and fed concentrate in the robots is shown in this table.

Cowcard events
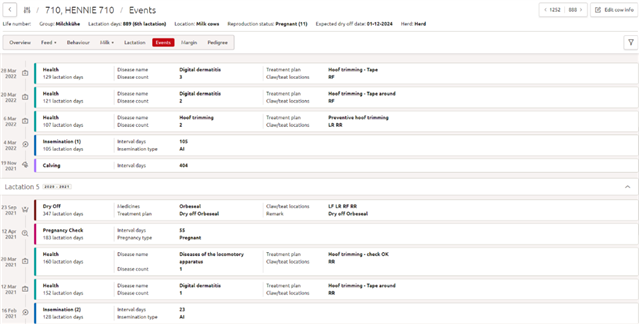
Multiple events happen during the lifetime of a cow. All events registered in Horizon can be found in the cowcard in calendar form. This calendar gives a quick overview of the cow’s history. For example, you can see the number of inseminations she needed in her previous lactations to get pregnant.
How do you use the events tab in the cowcard?
Step 1: Select a cow and go to the cowcard > Events
Step 2: A calendar will open. An overview of the registered events for this cow are now shown, sorted by lactation.
TIP! You can filter the event types shown by (de)selecting the different event types at the top of the calendar.
Cowcard icons
There are a number of icons in the lactation graph, the activity graph and in the menu. The pictures below comprise an overview of what each icon indicates. The icons that are marked in yellow on the cowcard, are an indication of the expected activity.
Icon library

Heat

Insemination

Reproduction check

Abortion

Dry off
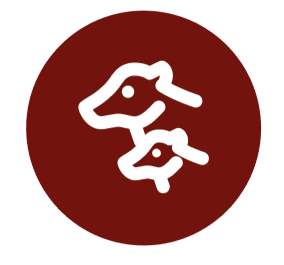
Calving

Disease

Medicine

Health treatment

Herd activity -> More than 20 percent of the herd is active due to first grazing of the year, herd hoof trimming or other activities
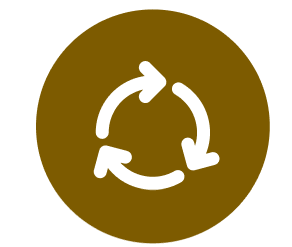
Transfer -> animal transferred between locations
Milk separation

Scores

Reminder
Expected calving

Expected dry off
