In our management system Lely Horizon you can fully optimize your dashboard and the cow card overview with the help of widgets. Widgets are ‘blocks’ with information and are multifunctional, as you can easily change settings in them, or you can click on them for more information. There is a tool for personalizing your dashboard as you like.
How do you personalize your dashboard?
Step 1: Go to the help function in the top right-hand corner and click Getting started. This will open the digital tours and also the personalisation settings. Clicking on personalisation will launch the onboarding flow which the farmer can use to set up their dashboard.
Step 2: If you click Start again, a new screen will appear which briefly explains the benefits of the new program.
Step 3: Click on Next to start personalisation. Read everything carefully and adjust the settings as required. You will need to complete 3 steps before you can finish personalisation:
Widgets KPIs Tasks & shifts
Step 4: Once you have finished, click on Continue to the dashboard.
TIP! You’ll need to refresh your screen (Ctrl + Shift + R) before you can see any of the adjustments you have made.
Which widgets are available?
Advice – A list with advice notes generated for your cows.
Milk yield prediction – Expected milk yield production per month at herd level.
Reproduction prediction – A herd overview for the coming 3 months.
Herd plan – Number of lactating animals of the previous 3 months and coming 6 months.
Weather – Weather forecast for the coming 7 days.
Margin per cow – The average gross profitability per cow.
Tasks – Overview of the important tasks that need to be performed.
Attentions – Alerts which need to be acted on immediately, such as the replacement of liners.
Favorite reports – Shows reports that are marked as ‘favorite report’.
Dry matter intake – Average dry matter intake over the past seven days per location type. Vector device status – Only for Vector farmers. Provides an overview about the status of the MFR, grabber, crane and PDB.
Dry matter intake widget & analysis
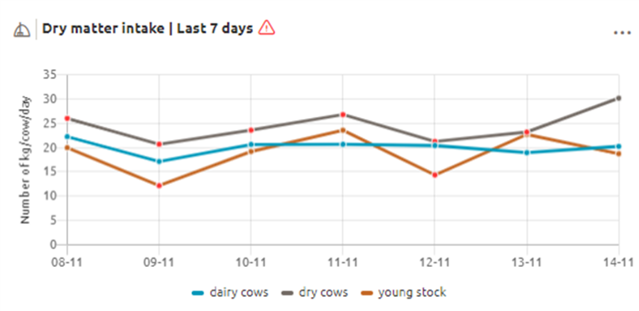
The dry matter intake widget shows the average dry matter intake for animals per location type (dairy cows, dry cows, young stock or beef) over the last 7 days. It concerns the dry matter intake per cow per day from feed materials that are provided during milking (Astronaut) and at the feeding fence (Vector). Clicking on the widget redirects you to the analysis page with the possibility of carrying out further analysis on the dry matter intake per ration and location.
How?
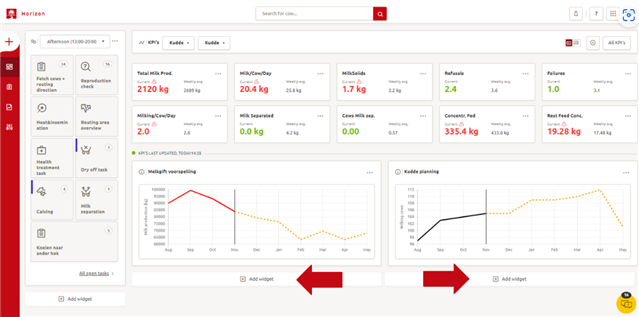
Step 1: the dry matter intake widget can be added to the dashboard by clicking on ‘Add widget’.
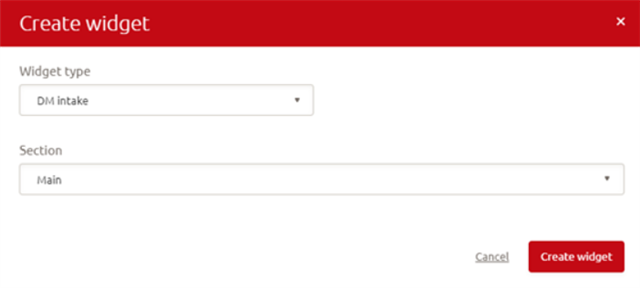
Step 2: select ‘DM intake’ as the widget type in the pop-up screen. Select the preferred dashboard section where the widget is to be added (‘left sidebar’ or ‘main’). If the widget is added to the left sidebar on the dashboard, it will show the dry matter intake over the last 5 days, whereas adding the widget to the main section of the dashboard will show the last 7 days. Click on ‘Create widget’.
Step 3: the widget becomes visible in the dashboard and shows the dry matter intake over the last 5/7 days for the animals based on the location type to which they are assigned. Be aware that it is important that the animal numbers per location are correct in order to reliably calculate the dry matter intakes.
Step 4: clicking on the widget will redirect you to the analysis page. The left-hand side of the page will have the following filter options: location type, ration and location name. In the bar chart at the top of the page, the average dry matter intake for the previous day is compared to the average over the last week and the current set ration. The bar chart at the bottom of the page shows the average dry matter intake per feedstuff in the ration for the previous day, the previous week and the current set ration. A tooltip with the values for each bar will appear if you hover over the bars in the chart.
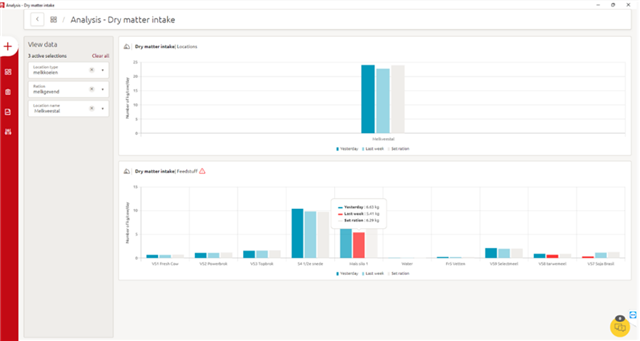
Using this widget and analysis page, you can monitor the dry matter intake and check whether the set ration is still in line with the current dry matter intake. If the set ration deviates from the dry matter intake, we recommend evaluating the set ration with a nutritionist.
Critical dashboard attentions
Critical dashboard attentions will appear on the Dashboard. These attentions are related to the replacement of liners and brushes, but also when the milk time is increased on a certain Astronaut. These are attentions which will need to be acted upon immediately.
Where can you find these critical attentions?
1. On the Dashboard
On the Dashboard, you will be able to find the attentions in either the left sidebar or in the main section. Critical dashboard attentions are shown as a widget and can therefore be placed as preferred.
Always place the widget in such a way that it is clearly visible on your dashboard and never remove this widget.
2. Widget on main section
If the widget of the critical attentions is in the main section, it will look like below. From this interface, you can go directly to the linked page or view the whole attention list (Go to attentions).
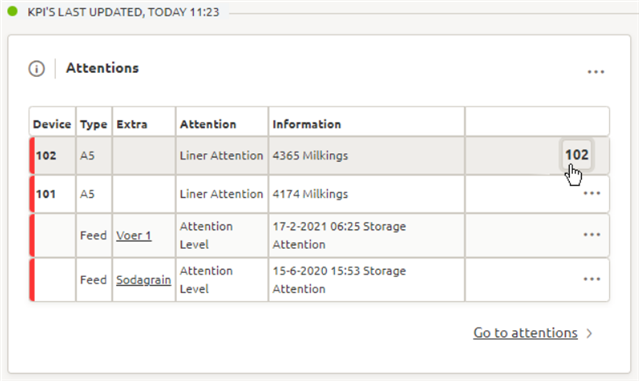
3. Widget on left sidebar
If the widget of the critical attentions is in the left sidebar, it will look like below. This interface provides less information. It will, however, show the type of attention and you can view the complete list by clicking on Go to attentions.
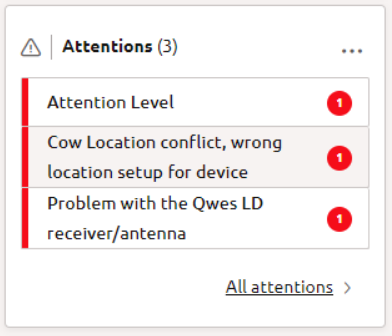
4. Attention list
If you click on Go to attentions in the widget, you will be taken to the complete list of attentions as shown below. Words indicated in red can be clicked on to open the specific setting overview. When opening the device, a pop-up will appear in which you can change all relevant information, e.g. if you wish to amend the date of the last liner change. Once you have changed the liner and change the date for the last liner change, the attention will be removed from the list.
What makes critical attentions appear?
As mentioned, critical attentions are attentions where an immediate response is required. Therefore, it is advised that the widget is checked on a regular basis.
Attentions that can occur in this widget are:
Replace liners
Liners need to be replaced occasionally. The time between liner changes depends on the liner type. Rubber liners need to be replaced every 2,500 milkings. Silicone liners need to be replaced every 10.000 milkings.
Replace brushes
Teat brushes need to be replaced every 30,000 milkings.
Replace Sleeve
As of 1 March 2023 (Maassluis) and as of 1 April 2023 (USA), the new shut-off sleeve type-2 for Astronaut robots is available. When attention is given, it’s easier to schedule future data so you won’t receive notifications anymore.
Feed stock storage
An attention will appear when the storage of the feed stock is almost empty. Order new feed and enter shipment.
Automatic backup failed
Check why the automatic backup failed. Go to Manage –> Software -> Backup and start a manual backup.
High DMT – Dead Milk Time
The average DMT is compared between the teats. Every teat is compared to the teat with the lowest average dead milking time. If the difference is above the threshold, an attention is given.
If a high DMT attention is given, check for broken hoses and check the pulsator, liners and bleed hole.
No milk time
A count is made of the number of cows the milking robot should have milked the teat for but only achieved a milk time of 0 seconds in the previous 24 hours. This attention can indicate that something is wrong with the milking system for that teat. If the number of cows is 10 or more, an attention is given for the root and the teat with the highest occurrence of low milk time.
When this attention is given, check the milking robot first at the bleed holes, hoses, liners and pulsator. After this, check in Horizon if the low milk time is caused by a high number of failures. The milk time per teat is shown per quarter in the Milking – Milk Visits Last 24H report. Decide whether some teats/cows might need to be dried off.
Increased milk time
Milking times are compared between the front teats and rear teats only. If the threshold is exceeded, an attention is given for the teat with the highest time. Check the milking system for possible cracks in hoses and check the liners, bleed holes and pulsator.
Long Distance LDN controller
The LDN controller can send an attention to Horizon when there is no tag data, the battery is low, or the device is offline.
Fat Protein Calibration
Every 90 days, the calculation for fat and protein by the MQC needs to be calibrated to make sure the values are measured correctly.
Advice widget
Advice notes are part of decision support in Horizon. The advice widget is a widget which shows a list with advice notes generated for your cows. Only the Ketosis & Failure reduction advice notes are shown here. Other advice notes, like the dry off ALERT or keep-open advice note, are only shown in tasks, because the advice widget shows you the advice notes that should be followed up on directly. These notes about specific cows should not stay active in the widget for a long time. So, for cows with a keep-open advice note, for example, you might want to wait until the next insemination moment to decide what you are going to do.
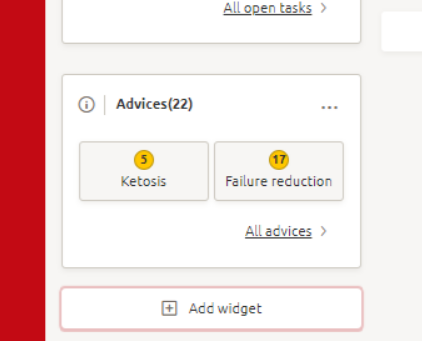
How do you use the advice widget?
Step 1: While on the dashboard, click on [+] Add widget at the bottom
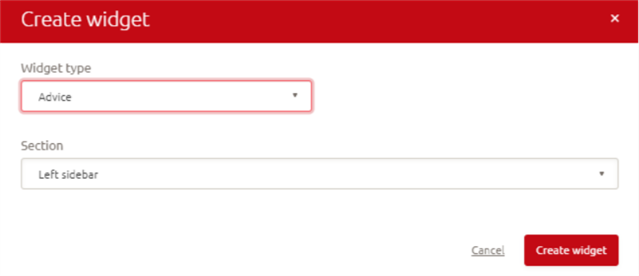
Step 2: Choose the widget type Advice.
Step 3: Choose if you want to have the widget on the left side bar or in the main dashboard.
Step 4: Click on Create widget to save the changes you have made.
Margin per cow widget
The margin per cow can be used to monitor the impact of an external factor on farm profitability and herd efficiency. If income and costs remain constant, changes in margin per cow provide insights into how changes in management, weather, herd health, and/or regulations may affect profitability.
Clicking the Margin per cow widget on the dashboard opens a page with more detailed information. This screen shows the herd trends over the last 6 months and gives an estimation of the herd’s margin per cow for the next 6 months. Furthermore, a graph is shown with the total milk income and total feed cost per for the prior 6 months and the expected coming 6 months.
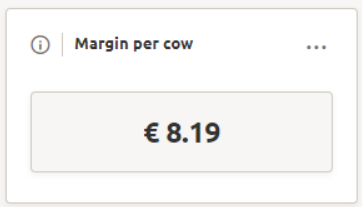
If no value is shown in the widget, please enter your prices into Lely Horizon.
More information about Margin per Cow, please click here.
Animal count widget
The cow count widget allows you to gain insights into the number of animals you have across different categories. To add the animal count widget to your dashboard, follow these steps:
Step 1: Click the ‘+ Add widget’ bar.
Step 2: Choose the ‘Animal count’ widget.
Step 3: Decide where to display the widget; either the left sidebar or the main area. If you select the left sidebar, the widget will also appear in the mobile app.
Step 4: Click ‘Create widget’, and it will be displayed on your dashboard.
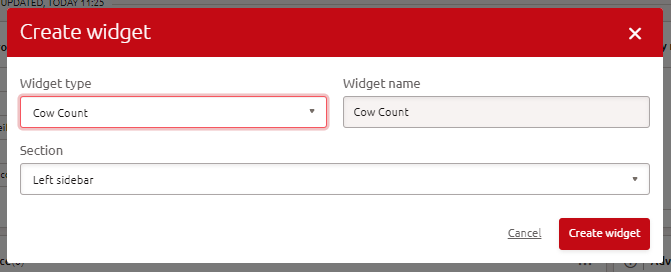
Adding the animal count widget
Tip: To rearrange the widgets on your dashboard, click the three dots in the upper right corner of the widget and select ‘Move 1 up’ or ‘Move 1 down.’ You can also edit or delete the widget from this menu.
How does it work?
The widget displays a single category but allows selection from multiple categories. The selectable categories include:
Production status > indicating the number of cows in various production statuses, such as lactation or dry-off.
Reproduction status > showing the number of cows in specific reproductive statuses, like pregnant, inseminated, or open.
Groups > displaying the number of cows in each group.
Locations > presenting the number of cows in each location.
Barn > displays the number of cows in a barn, or multiple barns if applicable.
Note: Please note that the categories Reproduction status and Locations for Vector farms are still under construction and are expected to be released soon.
The diagram illustrates the variance among the different subcategories, with the total number of animals displayed in the center for an overall summary. Adjacent to the diagram, the various subcategories are listed along with the count of cows that fit the criteria.
Note: The diagram is visible when there are fewer than 8 subcategories. If there are 8 or more, the diagram vanishes, and only the list of subcategories is displayed.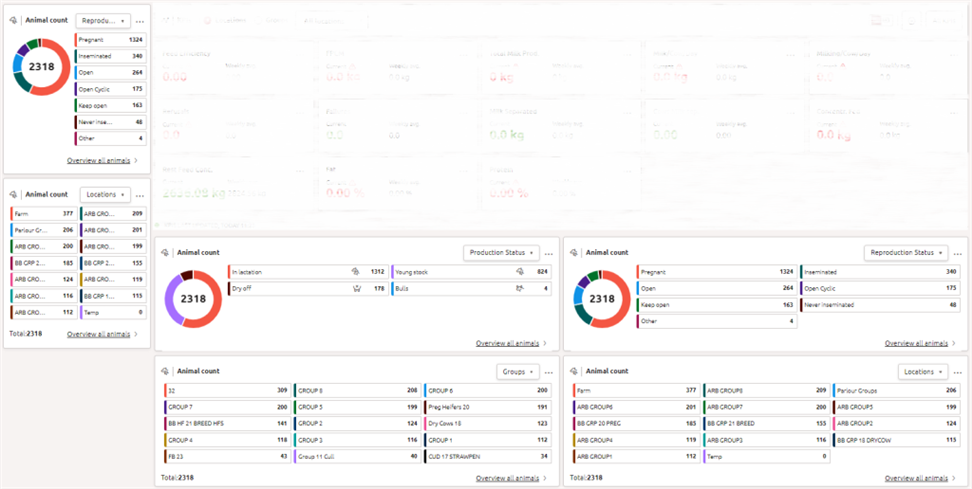
The animal count dashboard displayed on the dashboard
Clicking on ‘overview all animals‘ in the bottom right of the widget takes you to a filtered Report 17, sorted by category. For a more detailed view, selecting a specific subcategory will redirect you to Report 17, displaying only the animals within that subcategory. For instance, if you wish to view cows that have never been inseminated, simply click on the ‘never inseminated‘ subcategory to see a list of all such cows in Report 17.

Tip: Add multiple Animal Count widgets to your dashboard and assign a different category to each. This way, you can view various categories simultaneously, as the dashboard will recall the last category you selected.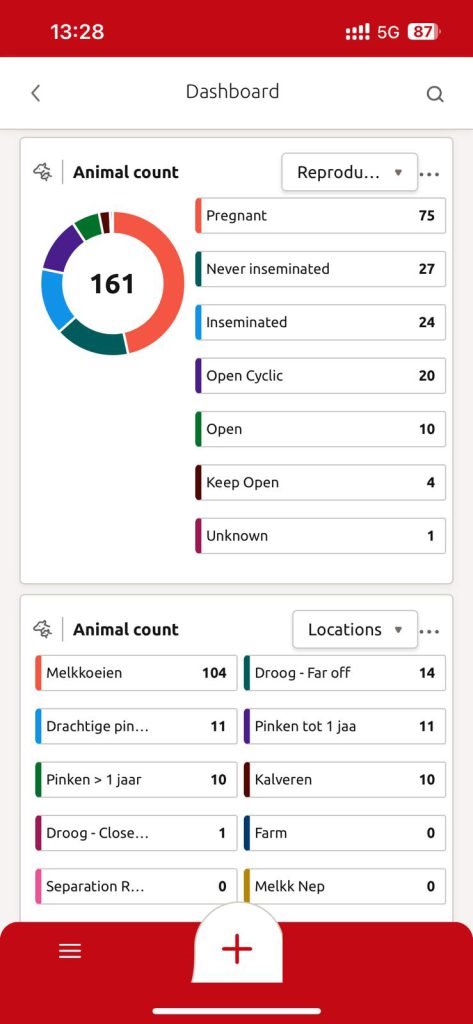
Animal count widget on mobile
Reproduction prediction widget
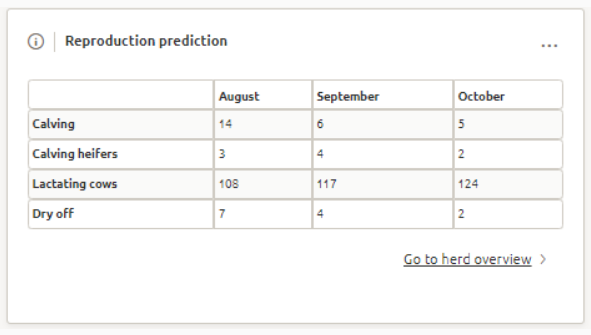
The reproduction widget provides you information about the herd for the coming three months in one simple overview. This is useful to prepare how many calving (heifers), dry offs and lactating cows you will have in the next period, as well as to help you make decisions (e.g. whether to sell a heifer or put a cow on keep open).
Calculation of reproduction widget
The numbers in the reproduction widget are calculated for the first day of each month. In the widget above, you can see 108 lactating cows. This number is calculated for the first of August and is the same for calving. If cows calve during the month, the number will not change – it is not subtracted from the numbers. The calculations are done monthly.
Herd overview
There is a link available in the reproduction prediction to go to the herd overview. This is more a comprehensive overview of your herd with data from the past and more data in the future. The information is shown as a graph.
