This feeding report will help you to gain insight into the average feed amounts and costs per cow per day of feed provided by Astronaut milking robots, Cosmix feeders or distributed by Vector for the selected location over the selected period.
Where can I find report 73?
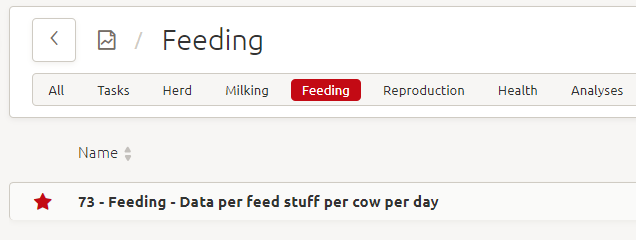
1) Click on Reports
2) Select the Feeding tab
3) Click on Report 73 Feeding – Data per feed stuff per cow per day


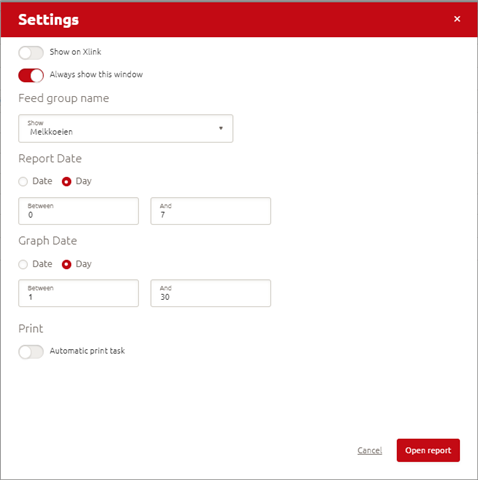
4) A Settings window will appear. Select the Feed group name from the dropdown and the period (between particular dates or days) for which data should be shown in the table (Report Date) and graph (Graph Date).
5) Click on Open report
Which information can be found in report 73?
The following information can be found in report 73:
- The date
- The location
- The number of animals
- The total fed amounts per cow per day displayed on a product or dry matter basis
- The average fed amounts per feedstuff per cow per day displayed on a product or dry matter basis
- The total feed cost per cow per day
- The feed costs per feedstuff per cow per day
Please be aware that prices and dry matter contents of feedstuffs should be regularly updated in order to make sure that feed costs and dry matter intakes are displayed correctly in this report.
The rows AVG and SUM show the average and the total sum for the period for which data is shown in the report.
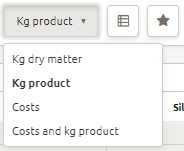
How can I change the feed amounts displayed on a product basis to a dry matter basis or vice versa?

Choose between kg dry matter or kg product from the dropdown in the top right-hand corner. It is also possible to view the costs only or together with the feed amounts on a product basis.
How can I hide and unhide columns?
Click on the ‘Customize columns’ button  Select the columns to display by ticking them.

How can I specify the period or locations for which data is shown in the report?
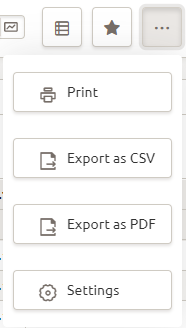
The period (between particular dates or days) and locations for which the report shows the data can be specified in the settings. The settings can be found as follows:
Click on the button with the 3 dots Click on ‘Settings’
How can I change from table view to a graphical view?
The table view can be changed to a graph by clicking on 
How can I hide and unhide feed types in the bar chart?
The feed types can be hidden or unhidden in the bar chart as follows:

or
Click on the parameter name in the legend underneath the bar chart. The name of feed type that is hidden is shown crossed out.

