This feeding report will help you gain insight into the average feed amounts and costs per cow per day of feed provided by Astronaut milking robots, Cosmix feeders or distributed by Vector for the selected location over the selected period.
Where can I find report 72?
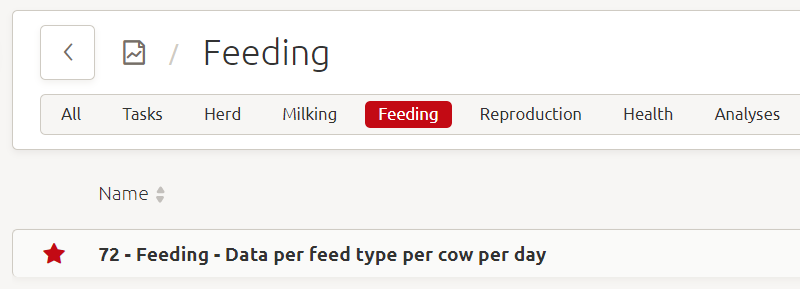
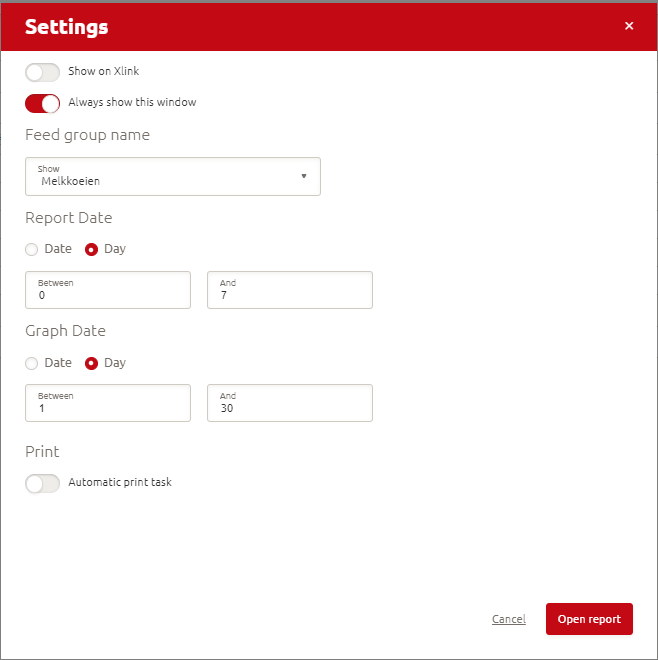
4) A Settings window will appear. Select the Feed group name from the dropdown and the period (between particular dates or days) for the data to be shown in the table (Report Date) and graph (Graph Date).
5) Click on Open report
What information does report 72 contain?
The following information can be found in report 72:
- Date
- Location
- Number of animals
- The total fed amounts per cow per day displayed on a product or dry matter basis
- The average fed amounts per cow per day of concentrates, roughage and minerals displayed on a product or dry matter basis
- The concentrates plus minerals to roughage ratio on a dry matter basisFeed costs per cow per day of concentrates, roughage and minerals
- The average rumination minutes
- Average day production per cow (not corrected for fat and protein levels)
- Average lactation days
- Feed efficiency, which is average day production divided by dry matter intake per cow (Feed efficiency = milk production / (concentrate from Astronaut (- rest feed from Astronaut) + mixed ration (Dosed weight – % rest feed)). Please note that:
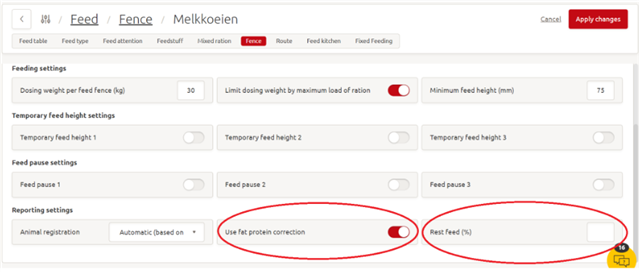
When use fat protein correction is activated on the fence page, milk is corrected in the fat and protein ratio in Vector reports and in the feed efficiency KPI on the main dashboard
The dry matter content of feed stuffs should be regularly updated in order to make sure that the correct dry matter intake is used in the calculation.
Dry matter intake per cow is corrected with the ‘rest feed %’ set on the fence settings page of the individual fence. Rest feed % on the fence page = feed you don’t want to feed the cows anymore. The goal of keeping track of your rest feed % is to estimate dry matter intake as precisely as possible. Common values for rest feed are between 1–5 %.
Rest feed can be measured by weighing the rest feed at the fence and comparing this to the dosed feed weight. One method could be:1) remove all rest feed 2) let the Vector feed as usual 3) after three days (or depending on the farm’s management) pause feeding for approximately six hours to let the cows eat all the high quality feed 4) remove and weigh all the rest feed 5) Calculate the rest feed using the following formula: %Rest feed = (KG measured rest feed / Total KG dosed feed between cleaning moments)* 100 6) enter the rest feed % in Horizon.
Rest feed % needs to be filled in manually. The frequency of changing the rest feed % depends on ration changes (for example, if you have made a change to your ration, it might be a good time to check the rest feed %) or when you notice fluctuations in dry matter intake.
The rows AVG and SUM show the average and the total sum for the data period covered in the report.

How can I change the feed amounts displayed from a product basis to a dry matter basis and vice versa?
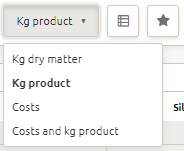
Choose between kg dry matter or kg product using the dropdown in the top right corner. It is also possible to view the costs only or together with the feed amounts on product basis
How can I hide and unhide columns?
Click on the ‘Customize Columns’ button  Select the columns you want to display by ticking them.
How can I specify the period or location of the data shown in the report?
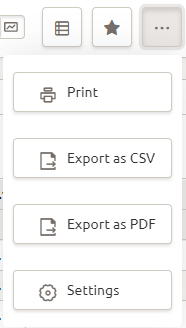
You can set the period (between particular dates or days) and locations of the data contained in the report in the settings. The settings can be found as follows:
Click on the button with the three dots Click on ‘Settings’
How can I change from table view to a graphics view?
Table view can be changed to graphics view by clicking on 
How can I hide and unhide feed types in the bar chart?
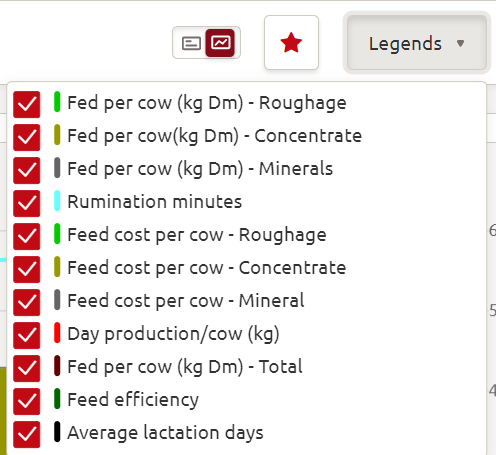
Feed types can be hidden or unhidden in the bar chart as follows:
Click on Legends in the top right-hand corneror
Click on the parameter name in the legend underneath the bar chart – hidden feed types are shown with a strikethrough.
