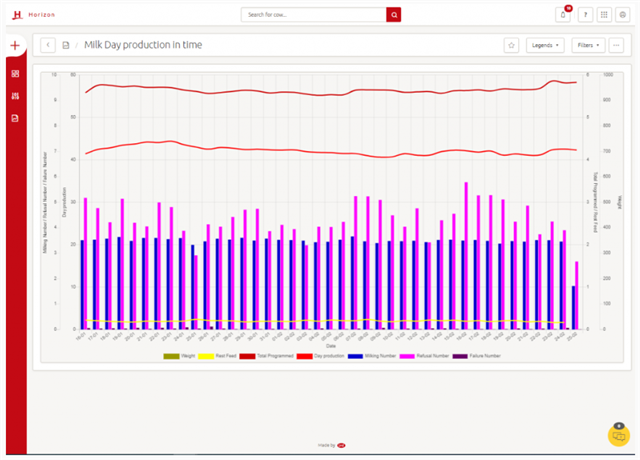
Go to Reports > Milking > Graph 20 – Milk Day in production time
This graph gives a clear insight into some general farm performance levels last month such as the visit behavior (milkings, refusals), failed milkings, milk production, weight, concentrates and rest feed.

TIP! the timeframe from this graph can be increased from 30 days up to 90 days in Settings. This provides better insight into farm performance over a longer period. This can especially be useful to monitor certain management decisions (e.g. ration changes).
