Key Performance Indicators (KPI's)
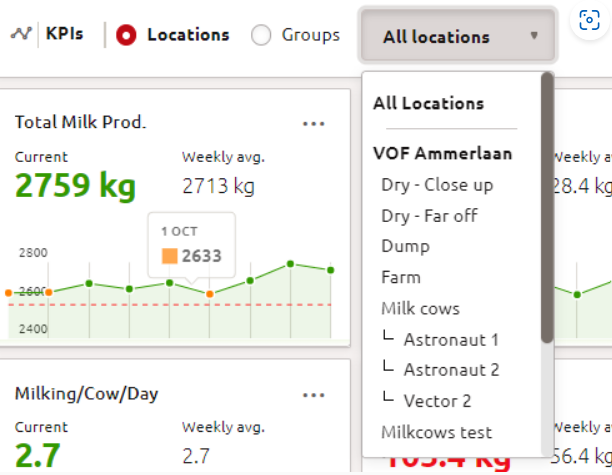
KPIs, short for key performance indicators, provide insights into the performance of the farm, the cows and the robots. The KPIs on the start screen show the performance for the previous seven days. In addition, the average for the past week and the current values are also shown.
How do you set KPIs on your dashboard?
If you would like to personalize your entire dashboard, including KPIs in a step-by-step approach via our built-in guided tour, go to the Help section > Getting started > Personalisation, and click on Start.

How to use the KPIs
Step 1: Select the herd or group whose KPIs you want to see.

Step 2: You can click on All KPIs in the top right to see all the available KPIs.
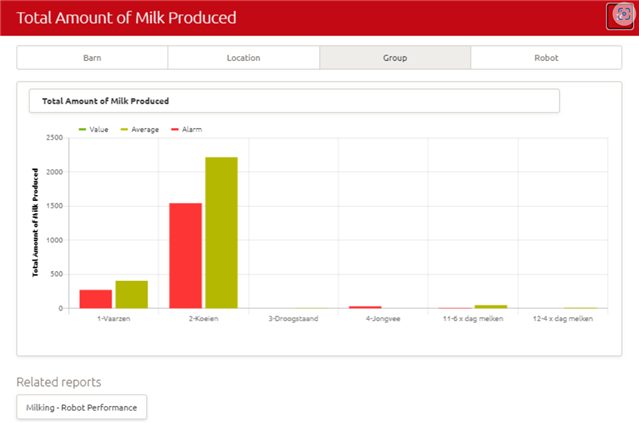
Step 3: Click on a KPI to get information about performance at barn, location, group or robot level.

KPI tresholds
KPI colours may change every 20 minutes. The colours are based on deviations. The calculation per KPI is different, and detailed information will be shown here.
| KPI name | Fixed/relative | |
| Number of Refusals | fixed | if <1 red else green |
| Number of Failures | fixed | if > 5 then red else if <3 green else orange |
| Number of Milkings/Cow/Day | fixed | if <2.5 red else green |
| Number of Connection Attempts | fixed | if >1.3 red else green |
| Total Amount of Milk Produced | relative | (-)if deviation is higher than 5% then red, 2% -5% orange, else green |
| Milk Production/Cow/Day | relative | (-) if deviation is higher than 5% then red, 2% -5% orange, else green |
| Number of Visit | relative | (-) if deviation is higher than %5 then red, else green |
| Milkspeed | relative | (-) if deviation is higher than %5 then red, else green |
| Amount of Milk Separated | relative | (+) if deviation is higher than 5% then red, else green |
| Number of Cows Milk Separation | relative | (+) if deviation is higher than 5% then red, else green |
| Kg Concetrates Fed | relative | (-) if deviation is higher than %5 then red, else green |
| Kg Rest Feed Concentrates | relative | (+) if deviation is higher than 10% then red, else green |
| Kg Concentrates per 100 kg Milk | relative | (+) if deviation is higher than 10% then red, else green |
| Kg Concentrates / Kg Milk >= 60 | relative | (+) if deviation is higher than 5% then red, else green |
| Kg Concentrates / lactationdays < 60 | relative | (+) if deviation is higher than 5% then red, else green |
| Average Boxtime / Visit | relative | (+) if deviation is higher than 5% then red, else green |
| Rumination Activity | relative | (+) if deviation is higher than 15% then red, 10% -15% orange, < 10% green |
| Rumination Activity | relative | (-) if deviation is higher than 15% then red, 10% -15% orange, < 10% green |
| Average Fat Indication | relative | (-) if deviation is higher than 5% then red, 2% -5% orange, else green |
| Average Protein Indication | relative | (-)if deviation is higher than 5% then red, 2% -5% orange, else green |
| Average Fat/Protein Ratio | relative | (-) if deviation is higher than 5% then red, 2% -5% orange, else green |
| Free Time % | relative | (-)if deviation is higher than 20% then red, 10% -20% orange, else green |
| Treatment time | relative | (+)if > 5 then red else if <5 green else orange |
| Feed Efficiency | relative | (-) if deviation is higher than 10% then red, else green |
| DM intake dairy cow | relative | (-) if deviation is higher than 10% then red, else green |
| DM intake | relative | (-) if deviation is higher than 10% then red, else green |
| Total Eating Minutes | relative | (+) if deviation is higher than 15% then red, 10% -15% orange, < 10% green |
| Total Eating Minutes | relative | (-) if deviation is higher than 15% then red, 10% -15% orange, < 10% green |
| Milk Production Energy Corrected | relative | (-) if deviation is higher than 5% then red, 2% -5% orange, else green |
| Rumination Activity Lactating Cows | relative | (+) if deviation is higher than 15% then red, 10% -15% orange, < 10% green |
| Rumination Activity Lactating Cows | relative | (-) if deviation is higher than 15% then red, 10% -15% orange, < 10% green |
